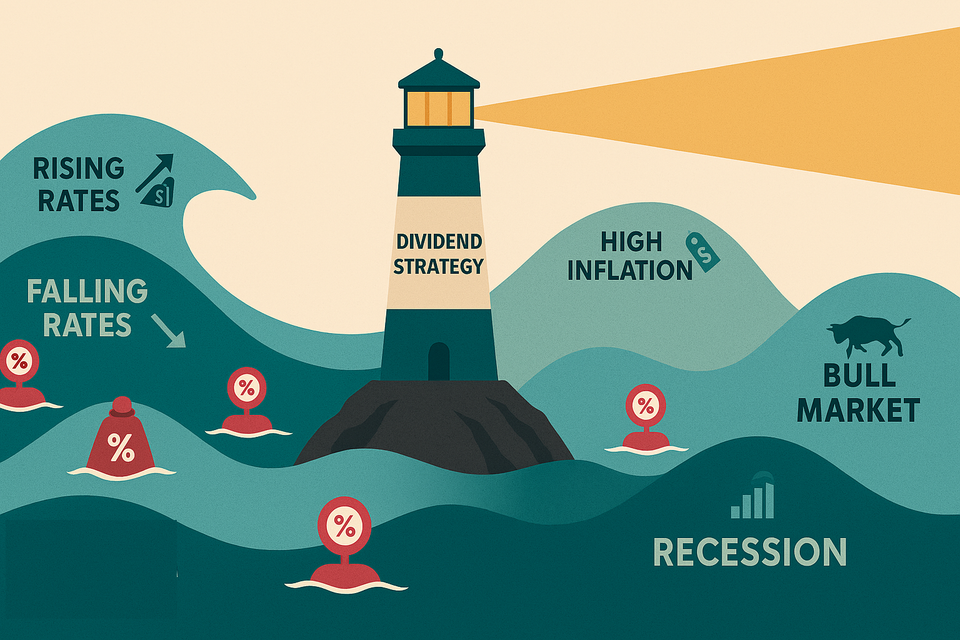
Covered Call ETFs - Hot Yield Trend
We examine the mechanics of covered call and option-income ETFs, exploring what drives their yields, and critically evaluate their place in a portfolio.

"High yields often signal higher risk; safety and growth of dividends are more important than chasing the biggest yield." --- Charles B. Carlson
Over the past three years, a new category of income vehicles has exploded in popularity: covered call ETFs and structured option-income funds. These products promise yields of 10%, 20%, even 50%+ annually, dwarfing traditional dividend stocks and bonds. Names like YieldMax, Global X, Roundhill, NEOS, and Defiance have flooded the market with funds bearing tickers like TSLY, NVDY, MSTY, and XDTE, each promising extraordinary income.
For income-hungry investors, particularly retirees watching traditional bond yields struggle to keep pace with inflation, these products seem irresistible. But as with all yield vehicles, understanding how the income is generated, what risks underlie it, and whether it's sustainable separates informed investing from expensive mistakes.
This article examines the mechanics of covered call and option-income ETFs, explores what drives their yields, and critically evaluates their place (if any) in a thoughtful dividend portfolio. This is education, not condemnation, the goal is to help you understand what you're buying.
What Are Covered Call ETFs?
A covered call ETF employs a specific options strategy: it owns a portfolio of stocks (or an index) and systematically sells (writes) call options against those holdings. By selling these calls, the fund collects option premium income, which it distributes to shareholders as yield.
The Mechanics
Imagine a fund that owns 100 shares of Tesla stock trading at $250. The fund sells a call option with a $270 strike price expiring in one month, collecting $5 per share in premium ($500 total). If Tesla stays below $270, the option expires worthless, the fund keeps the premium, and repeats the process next month. If Tesla rises above $270, the shares are "called away" (sold at $270), and the fund misses upside beyond that strike.
Over a year, the fund collects premiums monthly, generating substantial income. But it caps upside participation.
Single-Stock vs. Index Strategies
Funds fall into two broad categories:
Single-stock covered call funds (e.g., YieldMax TSLY on Tesla, NVDY on Nvidia, CONY on Coinbase): These hold a single stock and write calls against it. Yields can be extraordinary (20-60%+) because single-stock options carry high implied volatility, generating fat premiums.
Index covered call funds (e.g., Global X QYLD on Nasdaq-100, SPYI on S&P 500): These hold diversified index portfolios and write calls against the index or basket. Yields are more modest (7-12%) because index options carry lower implied volatility than single stocks.
How Do These Funds Generate Such High Yields?
The yields advertised by covered call funds stem from three sources, not all of which represent true income.
1. Option Premium Income
The primary source is the premium collected from selling call options. Option premiums are determined by:
- Implied Volatility (IV): Higher volatility = higher premiums. Tesla and Nvidia options carry enormous IV because these stocks are volatile. A Tesla option expiring in 30 days might command $10-$15 per share in premium because the stock could easily move $50 in either direction.
- Time Decay: Options lose value as expiration approaches. Selling short-dated options (weekly or monthly) captures this decay rapidly.
- Strike Price Selection: Selling calls at-the-money (current stock price) generates maximum premium but caps upside immediately. Selling calls out-of-the-money (above current price) generates less premium but allows some upside participation.
The strategy works beautifully when volatility is high and the underlying stock trades sideways or declines modestly. The fund collects premiums repeatedly without shares being called away.
2. Return of Capital (ROC)
This is where things get murky. Many covered call funds distribute far more than they earn in actual option income. To maintain advertised yields, they return shareholders' own capital as "distributions."
Consider a fund with a 40% advertised yield. If the fund generates only 20% in option premium income, the other 20% comes from ROC, literally returning your own money to you and calling it "income." ROC reduces your cost basis, deferring taxation but also reducing your principal. Over time, ROC erodes the fund's NAV (net asset value per share).
Why do funds use ROC? Marketing. A 40% yield attracts attention; a 20% yield does not. Funds aren't hiding this, ROC appears in tax forms and fund disclosures, but casual investors often miss it.
3. Underlying Asset Appreciation (Sometimes)
If the underlying stock appreciates modestly without breaching strike prices, the fund benefits from both premium income and capital appreciation. However, this is rare in practice because covered call strategies cap upside. If Tesla rises 50% in a year, a covered call fund on Tesla might capture only 10-15% of that gain due to called-away shares.
The Devil in the Details: What Drives Performance
Covered call fund performance hinges on factors that change constantly, making sustainability unpredictable.
Implied Volatility (IV): The Double-Edged Sword
High implied volatility generates fat premiums, driving yields. But IV isn't constant. Consider:
During volatility spikes (market crashes, earnings uncertainty, geopolitical crises): Volatility drives premiums surge. A fund might collect $15/share in premium one month because everyone fears a 20% stock move.
During volatility collapses (bull markets, low uncertainty): Premiums shrink. The same fund might collect only $3/share because the market expects minimal movement.
Example: In 2020-2021, Tesla's IV was extraordinarily high due to massive price swings (stock rose from $80 to $400, split-adjusted). Covered call funds on Tesla generated 30-50% yields. By 2023, as Tesla's volatility normalized, yields collapsed to 15-20%. Investors who bought expecting 40% yields saw distributions cut in half.
The implication: High yields are often temporary, driven by temporarily elevated volatility. When volatility mean-reverts, yields crater.
Underlying Stock Performance: Capped Upside, Full Downside
Covered call strategies create an asymmetric risk profile:
If the stock rallies hard: You capture premium income but miss most upside. Shares are called away at the strike. Your return is capped at strike + premium, often 5-10% in a month, even if the stock rises 30%.
If the stock falls hard: You experience the full loss, minus the small cushion from premium income. If a stock falls 40%, and you collected 5% in premium, you're still down 35%.
You earn modest premiums consistently, until one massive loss wipes out years of gains.
Real example: TSLY (YieldMax Tesla fund) launched in late 2022. Tesla rallied 100%+ in 2023. TSLY shareholders captured roughly 20% of that gain because calls were constantly exercised. Meanwhile, the fund distributed high yields funded partly by ROC. Shareholders received income, but drastically underperformed simply owning Tesla stock.
Fee Structures: Expensive by Design
Covered call ETFs carry expense ratios of 0.60% to 1.00%+, far higher than traditional index funds (0.03-0.10%). Additionally, many employ complex fee structures where management captures a percentage of option income.
Why does this matter? A 0.95% expense ratio on a fund yielding 12% consumes nearly 8% of your yield. On a $100,000 investment, you pay $950 annually in fees. Traditional dividend ETFs (VYM, SCHD) charge around 0.06% annually.
Over a decade, fee drag compounds. A 0.90% fee difference costs roughly 9% of cumulative returns. For a retiree counting on income, this is meaningful.
NAV Erosion: The Hidden Cost
Because many funds distribute ROC and cap upside participation, their NAV per share often declines over time. A fund launched at $25/share might trade at $18/share three years later, even as it paid distributions.
This isn't necessarily catastrophic if you're spending the distributions, you've received income along the way. But it means your principal is shrinking. If you need to liquidate the position, you sell at a loss.
Example trajectory:
- Year 1: Fund at $25, distributes $5 (20% yield). NAV falls to $22.
- Year 2: Fund at $22, distributes $4 (18% yield). NAV falls to $19.
- Year 3: Fund at $19, distributes $3 (16% yield). NAV falls to $17.
After three years, you've collected $12 in distributions but lost $8 in NAV. Net: $4 gain on $25 investment (16% total return over 3 years, or 5% annualized). A traditional dividend-growth stock might have returned 8-10% annualized with less volatility.
Why Investors Buy
Despite risks, covered call funds have legitimate appeal in specific circumstances.
For income-seeking retirees: A 10-12% yield is compelling when bonds yield 4% and quality dividend stocks yield 3%. If you need $50,000 annually from a $500,000 portfolio, a 10% yielder delivers it. Traditional vehicles require a much larger portfolio.
For tactical allocation: Some sophisticated investors use covered call funds tactically. If you believe a stock will trade sideways for six months (low volatility, no major catalysts), writing calls captures income without sacrificing much upside. Then you exit when conditions change.
For behavioral reasons: Some investors prefer receiving regular distributions, even if it's partly ROC, over capital appreciation. The psychological comfort of "getting paid" outweighs long-term efficiency.
For tax-deferred accounts: In IRAs or 401(k)s, ROC and tax complexity don't matter. If you're spending distributions in retirement and don't care about NAV preservation, the strategy can work.
The Case Against: Why Many Experts Are Skeptical
Critics, including many financial advisors and dividend-focused researchers, raise serious concerns.
1. Yield Chasing Creates Behavioral Traps
High advertised yields attract unsophisticated investors who don't understand the mechanics. They see "40% yield!" and assume it's sustainable income, not realizing it's ROC-fueled and driven by temporary volatility.
When yields inevitably fall (volatility normalizes, NAV erodes), these investors panic-sell at losses, having missed the opportunity to invest in sustainable alternatives.
2. Underperformance Over Full Cycles
Covered call strategies historically underperform buy-and-hold over full market cycles. During bull markets, capped upside devastates relative returns. During bear markets, full downside participation hurts. Only during sideways, high-volatility markets do they shine, and those periods are rare.
Empirical evidence: Studies of QYLD (Nasdaq-100 covered call ETF) show that from 2014-2024, it underperformed QQQ (Nasdaq-100 index) by roughly 60% cumulatively, despite paying higher distributions. This should not be a surprise, this is literally a product of how the fund is structured. But, an investor who reinvested QQQ dividends accumulated far more wealth. These funds are not Growth driven.
3. Complexity Obscures Risk
Options, NAV, ROC, expense ratios, strike selection, IV, these are complex. Most retail investors don't fully understand what they own. This information asymmetry benefits fund sponsors (who collect fees) at the expense of investors (who bear hidden risks).
Josh Peters' philosophy applies here: "If you can't explain an investment to a 12-year-old in two minutes, you probably don't understand it well enough to own it."
4. Structural Incentives Favor Fund Sponsors
Covered call funds generate enormous fees for sponsors. A 0.95% expense ratio on $2 billion AUM (assets under management) generates $19 million annually. Sponsors have strong incentives to launch these products, market them aggressively, and maximize AUM.
Compare this to traditional dividend ETFs like SCHD (0.06% expense ratio). A fund sponsor earns $1.2 million annually on $2 billion AUM. The industry profit motive is clear.
Evaluating Specific Fund Categories
Not all covered call funds are identical. Understanding differences helps you evaluate suitability.
Index-Based Covered Call Funds (JEPI, QYLD, XYLD)
Characteristics:
- Hold diversified index portfolios (S&P 500, Nasdaq-100)
- Write calls systematically against the index
- Yields: 7-12%
- Lower volatility than single-stock funds
- More predictable distributions
Strengths:
- Diversification reduces single-stock risk
- Volatility and distributions more stable
- Suitable for retirees needing predictable income
Weaknesses:
- Still cap upside participation
- Underperform index during bull markets
- Expense ratios 10-15x higher than index funds
- ROC still occurs, eroding NAV over time
Single-Stock Covered Call Funds (TSLY, NVDY, CONY, MSTY)
Characteristics:
- Hold single stocks (Tesla, Nvidia, Coinbase, Microsoft)
- Write calls against that single position
- Yields: 20-60%+ (highly variable)
- Extreme volatility, both in NAV and distributions
Strengths:
- Extraordinary yields during high-volatility periods
- Appeals to investors bullish on a specific stock but wanting income
Weaknesses:
- Extreme concentration risk (single stock)
- Yields collapse when IV normalizes
- Massive underperformance if underlying stock rallies sharply
- Full downside exposure if stock crashes
- Heavy ROC usage to maintain advertised yields
- High expense ratios (0.90-1.10%)
Structured Option-Income Funds (Various)
Some funds employ more complex strategies: selling puts, iron condors, straddles, or other multi-leg option structures. These promise "enhanced income" but add layers of complexity and risk.
Evaluation tip: If you can't explain the strategy in simple terms, consider if it is too complex for you to evaluate risk properly.
When Would You Use These Funds?
Covered call and option-income funds are most useful as situational tools and not core holdings in primary portfolios.
Situations where they might make sense:
1. Short-term tactical allocation (6-12 months): You believe a stock will trade sideways with high volatility, and you want to capture premium income. You monitor closely and exit when conditions change.
2. Small leveraged position (5-10% of portfolio): You allocate a small portion to high-yield vehicles for experimentation or income boost, understanding the risks.
3. Tax-deferred accounts only: ROC and fee complexity matter less in IRAs. You're spending distributions in retirement and don't care about NAV.
4. Sophisticated investors with professional guidance: You understand option mechanics, IV dynamics, and portfolio construction. You use these tools deliberately, not reactively.
Situations where they don't make sense:
1. Core retirement holdings: Don't build your portfolio around 40% yielders. Sustainable income comes from dividend-growth stocks and bonds, not option premiums. The "Buy and Chill" crowd suffered real pain lately doing this.
2. Taxable accounts: ROC creates basis tracking complexity. Fees and tax inefficiency compound.
3. Buy-and-hold investors: If you're not monitoring IV, strike selection, and NAV erosion closely, you're flying blind.
4. Investors who don't understand options: If terms like "implied volatility," "delta," or "theta decay" are foreign, you're not yet equipped to evaluate these funds.
A Better Alternative: Traditional Dividend Strategies
For most longer-term income investors, traditional strategies remain superior:
Build a diversified portfolio of:
- Dividend Aristocrats: 25+ years of increases, fortress balance sheets
- REITs: 4-6% yields, real estate exposure
- Utilities: 3-5% yields, regulated stability
- Investment-grade bonds: Predictable income, capital preservation
Expected portfolio yield: 3.5-4.5%, sustainable indefinitely.
Advantages over covered call funds:
- No NAV erosion from ROC
- Full upside participation in bull markets
- Lower fees (0.05-0.15% for ETFs)
- Tax-efficient (qualified dividends)
- Proven over decades
The math: A $500,000 portfolio yielding 4% generates $20,000 annually, growing with dividend increases. Over 20 years, dividends likely double (to $40,000 annually) while NAV appreciates. A covered call fund yielding 12% might generate $60,000 initially but see yields and NAV decline as volatility normalizes.
Which would you rather own in year 20?
Red Flags: Questions to Ask Before Buying
If you're considering a covered call or option-income fund, there are common aspects to consider:
1. What percentage of distributions is ROC? (Check fund tax documents. If >30%, the yield isn't sustainable.)
2. What's the expense ratio? (Above 0.50% is high for an income fund.)
3. What's the fund's IV assumption? (High yields depend on high IV. What happens when IV falls?)
4. What's the NAV trend? (Is NAV declining over time? That's your principal eroding.)
5. How does the fund perform vs. the underlying in a bull market? (If the stock rallies 50%, how much do you capture?)
6. Can I explain this strategy to someone else? (If not, you don't understand it well enough.)
7. Am I buying because of FOMO or marketing hype? (Honest self-assessment matters.)
If you can't answer these questions confidently, either learn more or consider another investment vehicle.
Conclusion: Education Over Emotion
Covered call and option-income funds represent financial engineering: using derivatives to manufacture yields that appear extraordinary. For sophisticated investors who understand the trade-offs (capped upside, NAV erosion, fee drag, volatility dependence) they can serve tactical purposes.
For most dividend investors, the core principles remain unchanged: sustainable income comes from quality businesses with durable cash flows, strong balance sheets, and histories of dividend growth, and diversification across sectors, account types, and asset classes. Sustainable success comes from patience, discipline, and compound growth over decades.
The allure of 30% yields is powerful, but as Kelly Wright warns, “Yield is not a guarantee of safety; the highest yields often have thorns best spotted with careful research.”
For long-term success, build your portfolio on fundamentals. Use the more exotic return instruments as tools, not your bedrock. You'll sleep better, compound faster, and retire wealthier.
References
Peris, Daniel. The Strategic Dividend Investor. McGraw-Hill, 2011.
Miller, Lowell. The Single Best Investment: Creating Wealth with Dividend Growth. Adams Media, 2006.