Healthy Dividends, Healthy Portfolio: The DYHI
At DividendIdeas, we devised the Dividend Yield Health Index—DYHI—to help systematically review securities and our portfolios.
Yield is the number that gets all the attention. A stock paying 8% when Treasuries pay 4% looks attractive on the surface. But that number alone tells you little about whether you'll still be collecting that dividend a year from now—or whether the share price will hold up while you wait.
Income investing done well requires looking past the headline yield. It means asking harder questions: Is this dividend sustainable? How will this holding behave if interest rates shift? Is the company carrying debt levels appropriate to its business? Can I exit this position if I need to?
At DividendIdeas, we devised the Dividend Yield Health Index - the DYHI - to help answer these questions systematically. It's not a buy signal or a sell signal. It's a diagnostic framework that helps us select healthy holdings and build robust portfolios with intention rather than hope.
One of DYHI's core design benefits is normalization. Income portfolios hold securities that differ dramatically—dividend-paying stocks, REITs, BDCs, closed-end funds, ETFs. These vary in structure, purpose, payment frequency, and sensitivity to interest rates. Comparing them on any single metric would be misleading. DYHI normalizes across these differences, producing a relative health score that allows meaningful comparison between a monthly-paying mortgage REIT and a quarterly-dividend industrial stock.
How DYHI Evaluates a Security
DYHI scores each dividend-paying security on a 0-100 scale across four pillars, each weighted according to its importance in assessing income sustainability.
Stability (40%) measures distribution reliability and price behavior. Has the dividend grown over time, stayed flat, or been cut? How volatile is the share price? What's the worst drawdown the security has experienced? A company that has steadily increased its dividend for a decade scores differently than one that slashed its payout two years ago.
Rate Environment (25%) captures how sensitive the security is to interest rate changes. Utilities and REITs, which compete directly with bond yields for investor attention, behave differently than floating-rate BDCs when rates move. This pillar measures that sensitivity and adjusts the score based on current conditions.
Leverage (20%) evaluates debt levels—but not with a one-size-fits-all ruler. A utility can sustainably carry more debt than a growth stock. A REIT operates with different capital structure norms than an industrial company. DYHI applies structure-appropriate thresholds—this is normalization in practice—so that a REIT's leverage is judged against REIT norms, not industrial company norms.
Liquidity (15%) assesses market entry and exit accessibility. Can you exit this position when you need to? Thinly-traded securities carry additional risk that isn't reflected in yield or fundamentals. This pillar ensures we're accounting for practical market access and low price variance when the security is traded.
The Scoring Scale
DYHI translates these four pillars into a composite score with clear interpretation:
- 80-100 (Strong): Low risk profile, stable distributions, favorable conditions
- 65-79 (Good): Solid fundamentals, manageable risks
- 50-64 (Moderate): Some concerns present, warrants monitoring
- 35-49 (Weak): Elevated risk, review position sizing
- 0-34 (Critical): Significant concerns, immediate review needed
The system also flags specific warning conditions: unusually high yield (which often signals market skepticism about sustainability), recent distribution cuts, thin trading volume, and elevated leverage.
A Score Reflects Two Things
An important nuance: a security's DYHI score reflects both its intrinsic health and its health within the current rate climate. A well-managed REIT with conservative leverage and a growing dividend might still see its score adjusted downward during a sustained period of rising rates—not because anything changed about the company, but because the environment has become less favorable for rate-sensitive income securities.
This dual nature is intentional. We want DYHI to tell us not just "is this a healthy company?" but "is this a healthy holding right now in this rate climate?"
Data Refresh Cadence
DYHI updates as fast as the underlying data allows. Price-based metrics like volatility, drawdown, and liquidity refresh daily as markets trade. Other metrics depend on company reporting schedules—distribution changes flow through as they're announced, leverage data updates with quarterly filings.
Different security classes operate on different timelines. A monthly-paying closed-end fund reports more frequently than a quarterly-dividend stock. An ETF with daily NAV transparency offers different data availability than an externally-managed BDC. The score you see reflects the best available public data at any given time.
The Interest Rate and Curve Climate
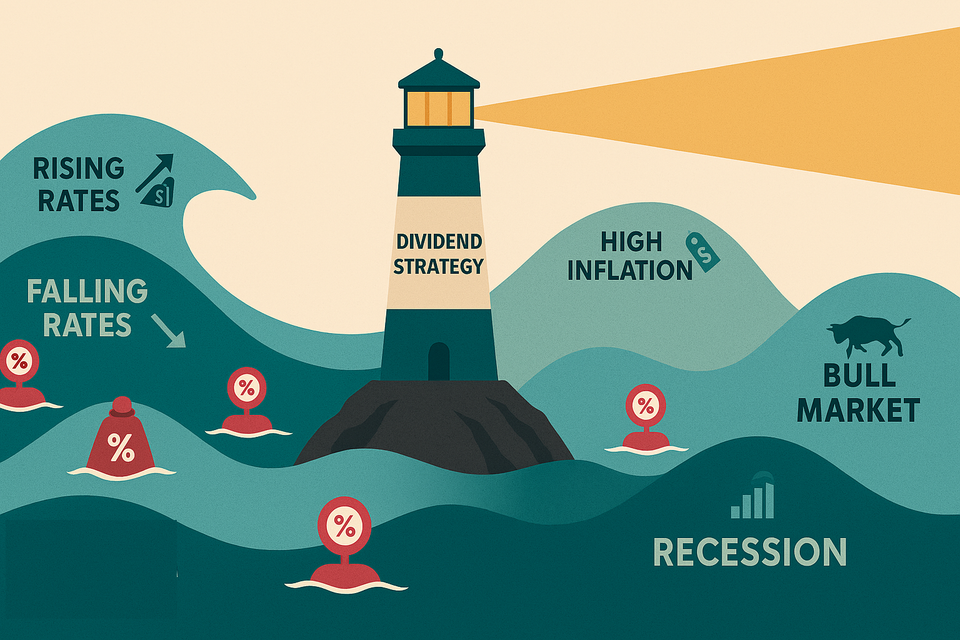
Interest rates matter to income investors in ways that growth investors can largely ignore. When Treasury yields rise, income securities face direct competition from risk-free alternatives. When borrowing costs increase, leveraged structures like REITs and BDCs see their margins compressed. When the yield curve inverts, it often signals economic stress ahead—stress that can pressure corporate earnings and dividend coverage.
DYHI tracks the rate climate and classifies it into three states: Rising, Stable, or Falling, based on movement in benchmark Treasury yields over a trailing period. This classification drives how we assess rate-sensitive holdings.
Beyond direction, we monitor yield curve shape. A normal upward-sloping curve—where longer-term rates exceed short-term rates—reflects healthy economic expectations. An inverted curve, where short-term rates exceed long-term rates, has historically preceded economic contractions.
Not all inversions are meaningful. Brief inversions happen and resolve without consequence. But sustained inversions—those lasting 63 or more consecutive trading days—have historically preceded recessions with roughly 73% accuracy. When we detect a sustained inversion, DYHI applies additional scoring pressure to rate-sensitive securities. The more sensitive the holding, the larger the adjustment.
This isn't a prediction that recession is coming. It's an acknowledgment that risk profiles have shifted and that holdings with high rate sensitivity now face a less favorable environment.
From Security Scores to Portfolio Health
Every security we evaluate receives a DYHI score. This score becomes one input—among several—when we build and adjust portfolios.
Each DividendIdeas portfolio pursues its own investment hypothesis. Some prioritize yield. Some prioritize dividend growth. Some focus on specific sectors or security types. The selection of securities and the industries we review is informed by DYHI as we determine risk and reward within each portfolio's strategy. A lower-scoring security isn't automatically excluded, but it faces a higher bar—there needs to be a compelling thesis to offset the elevated risk indicators.
Portfolio-Level DYHI
Beyond individual scores, we calculate a composite DYHI for each portfolio. This aggregate tells us something that individual scores cannot: how healthy is the income stream as a whole?
We compute this two ways. Value-weighted DYHI gives more influence to positions you own more of—if your largest holding is healthy, that matters more than the health of a small position. Income-weighted DYHI gives more influence to positions generating more of your dividend income—because that's what you're ultimately depending on.
When these two measures align closely, the portfolio's risk profile is consistent. When they diverge meaningfully—when your income-weighted score is notably lower than your value-weighted score—it signals that your income stream may carry more risk than your portfolio's market value suggests. Perhaps a smaller position is generating an outsized share of income, and that position has concerning health indicators. The divergence is a signal to examine income concentration.
Diversification as Stability
A well-constructed income portfolio absorbs individual-security turbulence. One holding's score decline—or even a dividend cut—shouldn't unhinge the entire income stream. That's the point of deliberate diversification.
DYHI helps us monitor whether that principle is holding. If portfolio-level DYHI remains stable while individual holdings fluctuate, the diversification is working. If portfolio-level DYHI starts to decline in concert with several holdings, something more systematic may be happening that warrants attention.
Monitoring Thresholds for Action
DYHI is a canary in the coal mine. It tells you to pay attention. You need to choose what to do.
Individual Security Movement
When a security's score crosses from one classification band to another—say, from Good to Moderate—we note it. If it continues declining or crosses below the Moderate threshold, we add it to an active watchlist. If a new warning flag appears, we investigate the underlying cause.
Individual fluctuations are expected. Markets move. Earnings reports surprise. Rate expectations shift. A security bouncing between 68 and 72 isn't signaling anything actionable. A security that was 75 six months ago and is now 48 deserves research into what changed.
Portfolio-Level Movement
Portfolio-level DYHI movement matters more than individual security noise, precisely because it's diversified across holdings. If the portfolio score declines materially, something broader is affecting multiple positions—and that's when we review the thesis.
Similarly, if we detect a sustained yield curve inversion, we revisit our allocation to rate-sensitive holdings. Not in a panic, but as part of our planned rebalancing framework. The signal prompts the review; it doesn't dictate the response.
Rebalancing Portfolios
Each portfolio we explore defines its own rebalancing approach relative to shifts in rate climate and security health. DYHI informs that conversation—it doesn't make the decision.
The value of having a framework like DYHI is that it enables pre-defined responses. When the rate climate shifts from stable to rising, what's your plan for rate-sensitive holdings? When a sustained inversion is detected, have you already decided how you'll adjust? When a holding's score drops into concerning territory, what research will you conduct before acting?
Defining these responses in advance—during calm conditions—beats improvising under pressure. DYHI gives you the information to execute your plan rather than scramble to create one.
What DYHI enables you to do
DYHI is a diagnostic tool built on publicly available data. It reflects the best information available at the time of publication, but it has limitations worth acknowledging.
The score is backward-looking. Distribution history, price volatility, leverage ratios—these describe what has happened, not what will happen. DYHI identifies risk factors; it doesn't predict which companies will cut their dividends next quarter.
A low score doesn't mean "sell now." A high score doesn't mean "buy more." Scores provide context for decision-making, not decisions themselves. A security with a Weak score might still be appropriate for a portfolio with a specific thesis and appropriate position sizing. A security with a Strong score might still be overvalued or unsuitable for your strategy.
DYHI is one input among many. It works best when combined with your own research, your understanding of individual holdings, and your clearly defined investment thesis.
Health as a Long-Term Discipline
Building sustainable income isn't about finding the highest yields. It's about assembling a portfolio of healthy holdings that can deliver reliable income through varying market conditions and rate environments.
The Dividend Yield Health Index provides a systematic way to evaluate that health—security by security and portfolio-wide. It helps us be deliberate rather than reactive, disciplined rather than hopeful.
Regular monitoring beats reactive scrambling. Understanding your portfolio's health profile before conditions change means you can respond from a position of knowledge rather than surprise.
The goal isn't to chase the highest score or avoid all risk. It's to build portfolios where the risks are understood, the income is sustainable, and the dividend checks keep arriving—quarter after quarter, year after year.
That's what healthy dividends and healthy portfolios are all about.